
Our AI systems do analyze real time the trend in multi time frame of multi-currency and crypto-currency. In our trend heat map dashboard content all information about the trend as detail:
Multi timeframe, multi- currency-asset: You can select your watch list in Setting section.
In our trend dash board you will see the information about trend in multi time frame from M15 to D1.
The overall information of the trends easily quickly get from the dashboard trend heat map with below information:
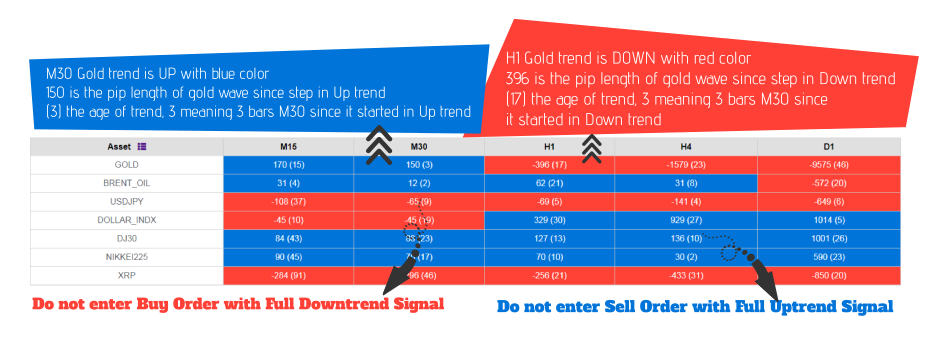
The easiest way to take overlook the trend of all market. You should not only check the direction of trend of your pair but also check all pair what high correlation with your pair. Example: when you trade AUDUSD you should check also the trend of AUDJPY and USDCAD which has more than 60% correlation with AUDUSD. You can see how to check the correlation trading in Helping check correlation trading...
Take advantage of the confirm/opposite signal between timeframe of each pair. These some advice for trader using our trading heat map:

Services
